
In today's interconnected business landscape, your network is the central nervous system of your operations. For small to midsize businesses (SMBs), downtime isn't just an inconvenience; it's a direct threat to productivity, security, and revenue. With the rise of cloud solutions, remote work, and sophisticated cyber threats, simply knowing if a server is 'up' or 'down' is no longer enough. You need deep visibility to proactively identify performance bottlenecks, detect security anomalies, and ensure your cloud investments are delivering value.
This guide cuts through the noise to analyze the 12 best network monitoring tools tailored for the unique challenges of SMBs. We'll explore how these solutions leverage AI, secure your hybrid cloud environments, and provide the actionable insights needed to keep your business resilient and productive. Each entry provides a concise overview, key features, practical pros and cons, and deployment considerations, complete with screenshots and direct links to help you make an informed decision.
We are focused specifically on the network layer, which is critical for connectivity and performance. However, for a complete picture of your IT environment's health, it’s also wise to understand how these systems fit into a larger strategy. Exploring a broader array of top infrastructure monitoring tools can provide that more holistic view of system health, covering servers, storage, and virtualization. Our goal is to equip executives and IT leaders in Western Pennsylvania and Eastern Ohio with a practical resource to select the right platform, whether for in-house management or to augment a managed IT support partnership with a provider like Eagle Point.
1. Datadog
Datadog is a comprehensive, cloud-native observability platform that excels at unifying data from disparate sources. While it's known for application performance monitoring (APM) and infrastructure management, it also provides some of the best network monitoring tools for businesses that require correlated visibility across their entire tech stack. Instead of viewing network performance in a silo, Datadog allows you to see how network latency impacts application traces, user experience, and infrastructure health, all within a single interface.
This makes it an ideal solution for SMBs leveraging cloud solutions and modern microservices architectures. The platform's strength lies in its extensive library of over 1,000 integrations, making it easy to pull in metrics from cloud providers like AWS and Azure, as well as on-premise devices. Its Network Device Monitoring (NDM) and Network Performance Monitoring (NPM) products provide deep insights into traffic flow, device health, and DNS performance, which are critical for both security and cloud performance.
Key Considerations
- Deployment: As a SaaS platform, deployment is fast. You install lightweight agents on your hosts or configure cloud integrations, and data begins flowing almost immediately.
- Use Case: Best suited for cloud-centric or hybrid environments where understanding the relationship between network, infrastructure, and application performance is critical for troubleshooting security and performance issues.
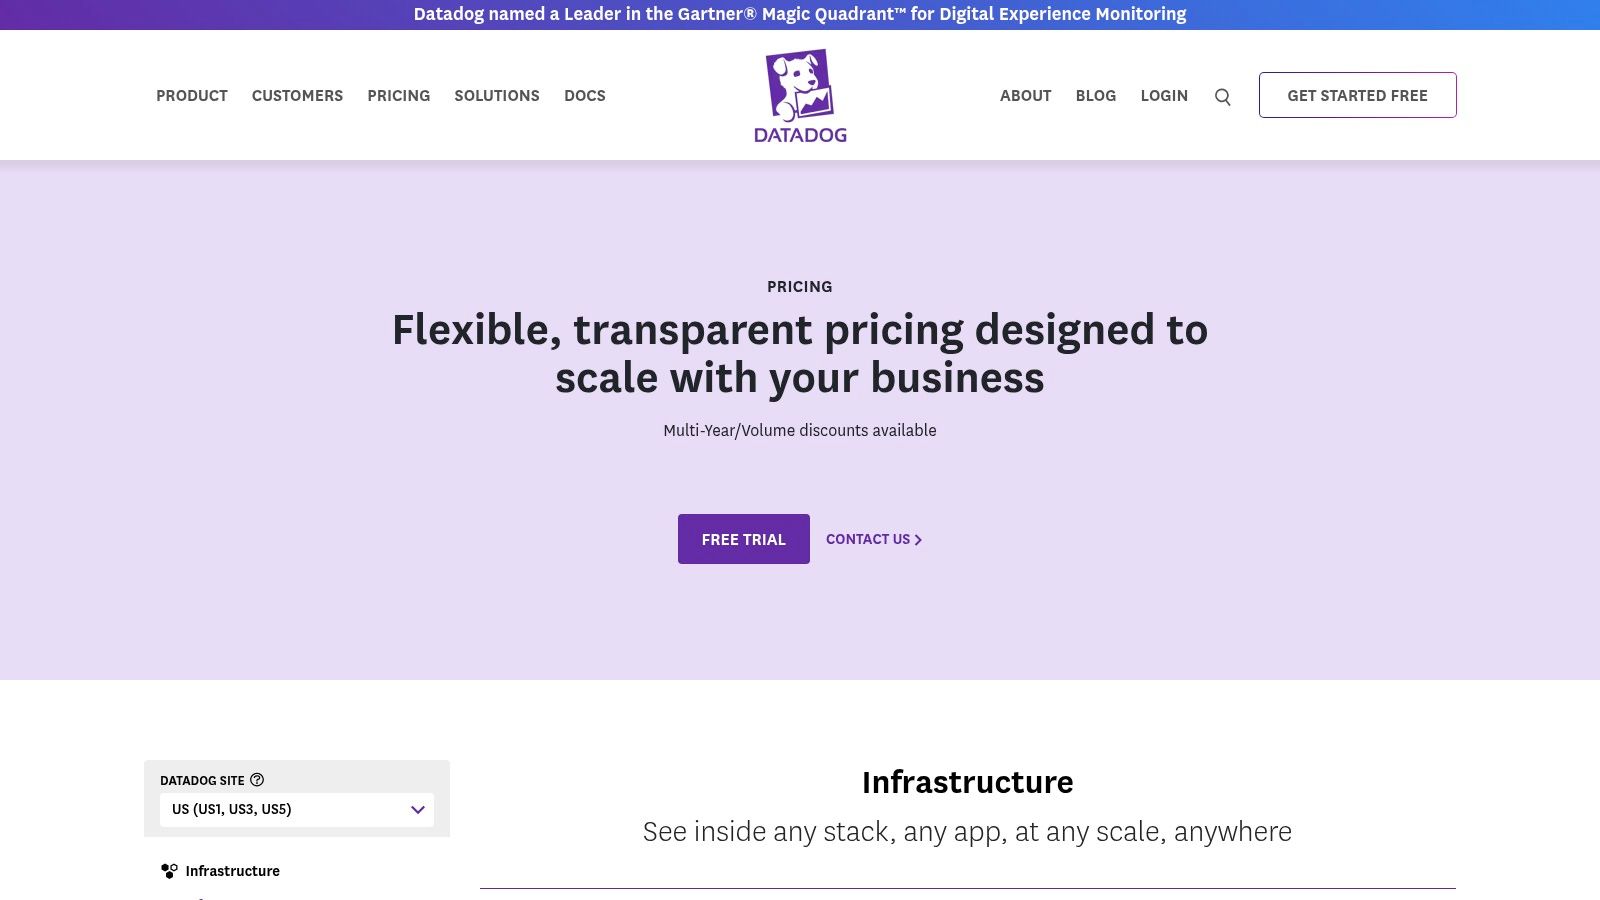
- Pricing: Datadog uses a modular, consumption-based pricing model. This is great for starting small but can become complex and costly at scale. A free tier is available for exploration.
| Pros | Cons |
|---|---|
| Granular, easy-to-start pricing and free trial | Pricing can escalate quickly with multiple modules |
| Strong ecosystem with 1,000+ integrations | Can have a steep learning curve for observability beginners |
| Correlates network data with logs, apps & infra | Core focus is broader than just pure network monitoring |
For businesses seeking to leverage Datadog without dedicating internal resources to its management, exploring managed IT services for Datadog can provide expert configuration and ongoing oversight.
Website: https://www.datadoghq.com/pricing/
2. LogicMonitor
LogicMonitor is a unified observability platform that offers some of the best network monitoring tools for organizations managing complex hybrid IT environments. Powered by AIOps, it provides agentless monitoring across on-premise infrastructure, cloud services, and network devices from a single SaaS solution. This AI-driven approach gives businesses a comprehensive view of performance without the overhead of deploying agents on every device, making it a strong choice for teams that need to monitor a diverse and distributed cloud stack efficiently.
The platform stands out with its vast library of over 3,000 pre-built integrations and its AI-assisted alerting, which helps reduce alert fatigue by identifying anomalies and forecasting potential issues. This proactive stance is invaluable for SMBs seeking to minimize downtime and secure their cloud infrastructure. By correlating data from network traffic, device health, and cloud resources, LogicMonitor helps teams quickly pinpoint the root cause of problems, whether they originate on a local switch or within an AWS VPC.
Key Considerations
- Deployment: The SaaS model uses a lightweight, agentless "Collector" installed on a host within your environment. This Collector discovers and polls devices, sending data securely back to the LogicMonitor platform for analysis and visualization.
- Use Case: Ideal for organizations with a mix of on-premise hardware and cloud services that want a single tool for visibility. Its AIOps capabilities are particularly useful for teams looking to automate monitoring and move toward proactive IT management and security.
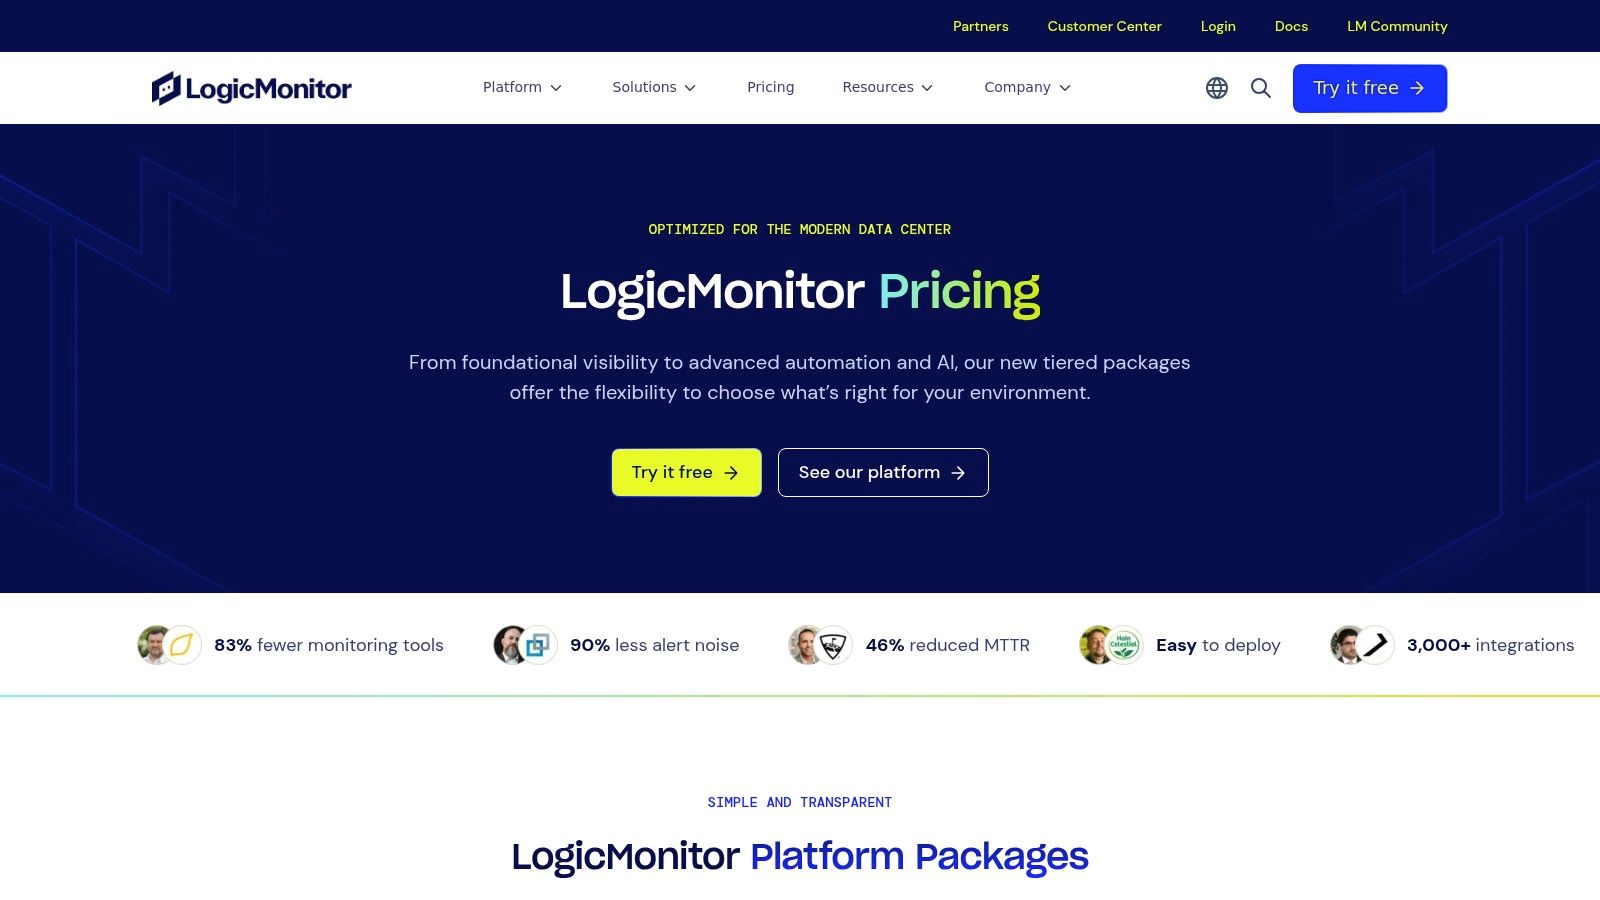
- Pricing: LogicMonitor uses a tiered, device-based pricing model with published starting points. This transparent approach simplifies budgeting compared to pure consumption models, although accurately mapping your assets to their "Hybrid Unit" tiers is an essential first step.
| Pros | Cons |
|---|---|
| Transparent, tiered pricing simplifies budget forecasting | Estimating Hybrid Unit counts requires an asset inventory |
| Broad coverage for network, infrastructure, and cloud | Advanced AI features are reserved for higher-tier plans |
| Agentless data collection simplifies deployment and scaling | Initial configuration can be complex for very diverse nets |
Website: https://www.logicmonitor.com/pricing
3. SolarWinds (Network Performance Monitor & Observability)
SolarWinds is a long-standing leader in IT management, offering some of the best network monitoring tools available. Its flagship product, Network Performance Monitor (NPM), provides deep, multi-vendor device monitoring, intelligent mapping, and advanced alerting. For organizations moving toward full-stack visibility, the newer SolarWinds Observability SaaS platform extends these capabilities into a cloud-native solution, combining network insights with application, infrastructure, and log data.
The platform's strength lies in its maturity and network-centric feature set, including unique tools like NetPath for visual hop-by-hop path analysis and PerfStack for correlating performance data across the stack. This makes it an excellent choice for teams that need robust, traditional network monitoring with a clear path to modern, cloud-based observability. This detailed visibility is also crucial for a strong security posture, a key component of comprehensive cybersecurity solutions for businesses.
Key Considerations
- Deployment: Offers a choice between self-hosted (NPM on Windows/SQL Server) for maximum control or a fully managed SaaS platform (SolarWinds Observability) for faster deployment and reduced overhead.
- Use Case: Ideal for businesses with complex on-premise or hybrid networks that require deep network-specific features but also want the option to expand into full-stack observability in the cloud.
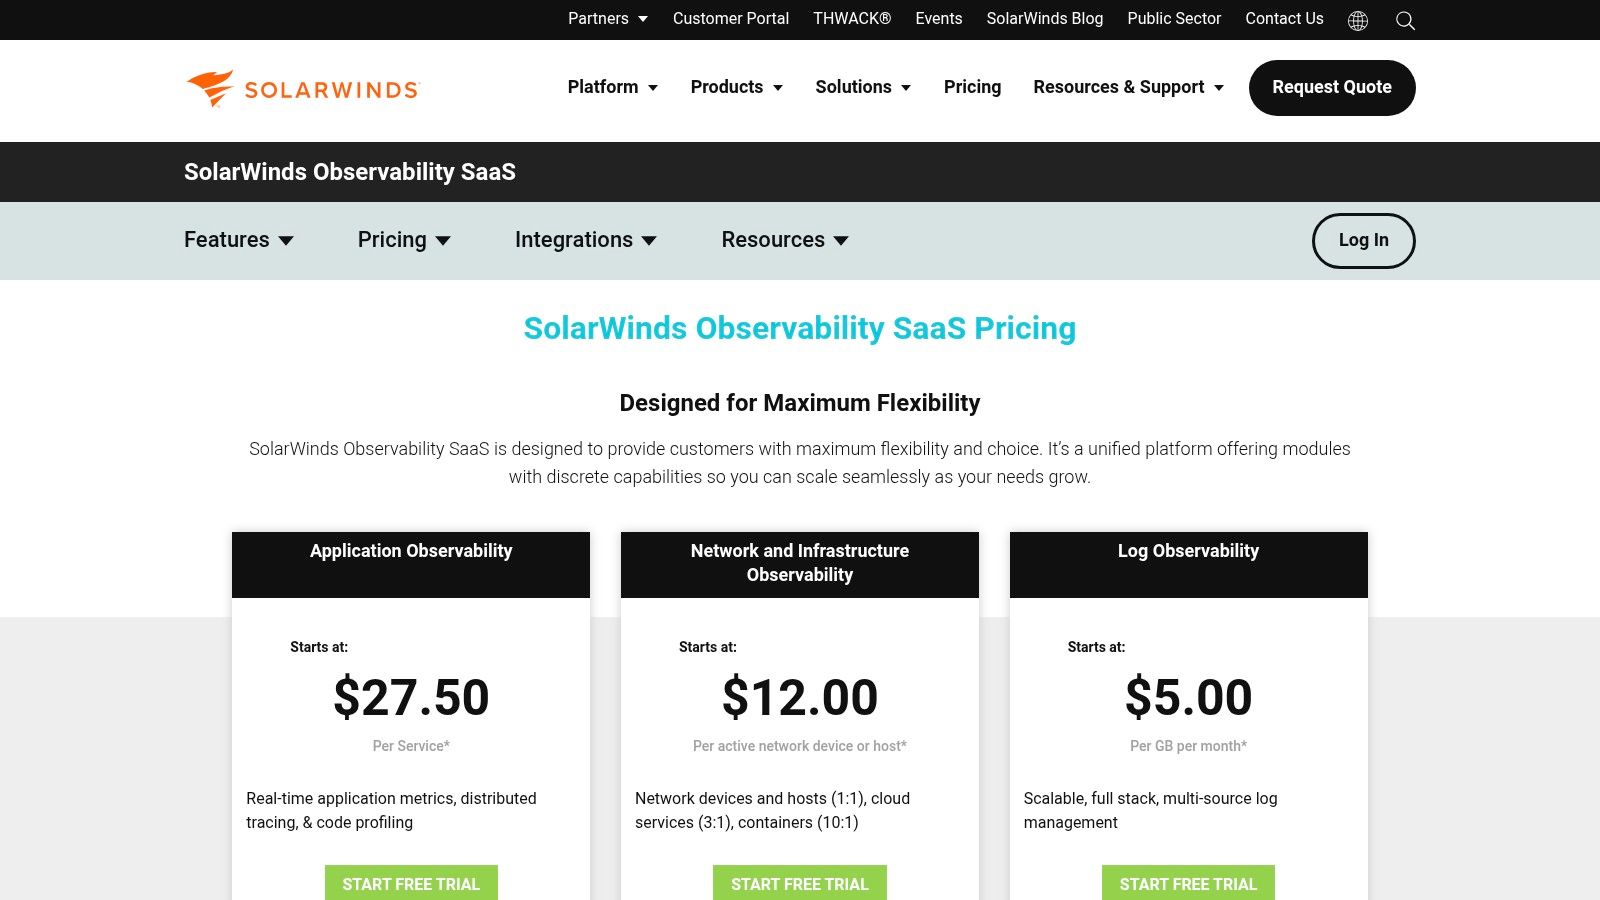
- Pricing: NPM is priced per-device, while the Observability platform is priced per-host. Both options offer 30-day free trials, allowing for extensive evaluation before purchase.
| Pros | Cons |
|---|---|
| Mature network-specific features and intelligent maps | Self-hosted requires Windows/SQL backend and scaling care |
| Choice between self-hosted and SaaS deployments | UI/operations can be complex for very small teams |
| Volume discounts and enterprise deployment patterns | Observability SaaS is a newer offering than the core NPM |
Website: https://www.solarwinds.com/solarwinds-observability/pricing
4. ManageEngine OpManager
ManageEngine OpManager is a powerful, self-hosted network monitoring platform that appeals to IT teams seeking granular control and predictable pricing. It provides a comprehensive suite of tools for monitoring network devices, servers, and virtualized infrastructure, making it one of the best network monitoring tools for organizations that prefer on-premise solutions. Its strength lies in its straightforward, device-based licensing model, where monitoring for interfaces, sensors, and system resources is included per device.
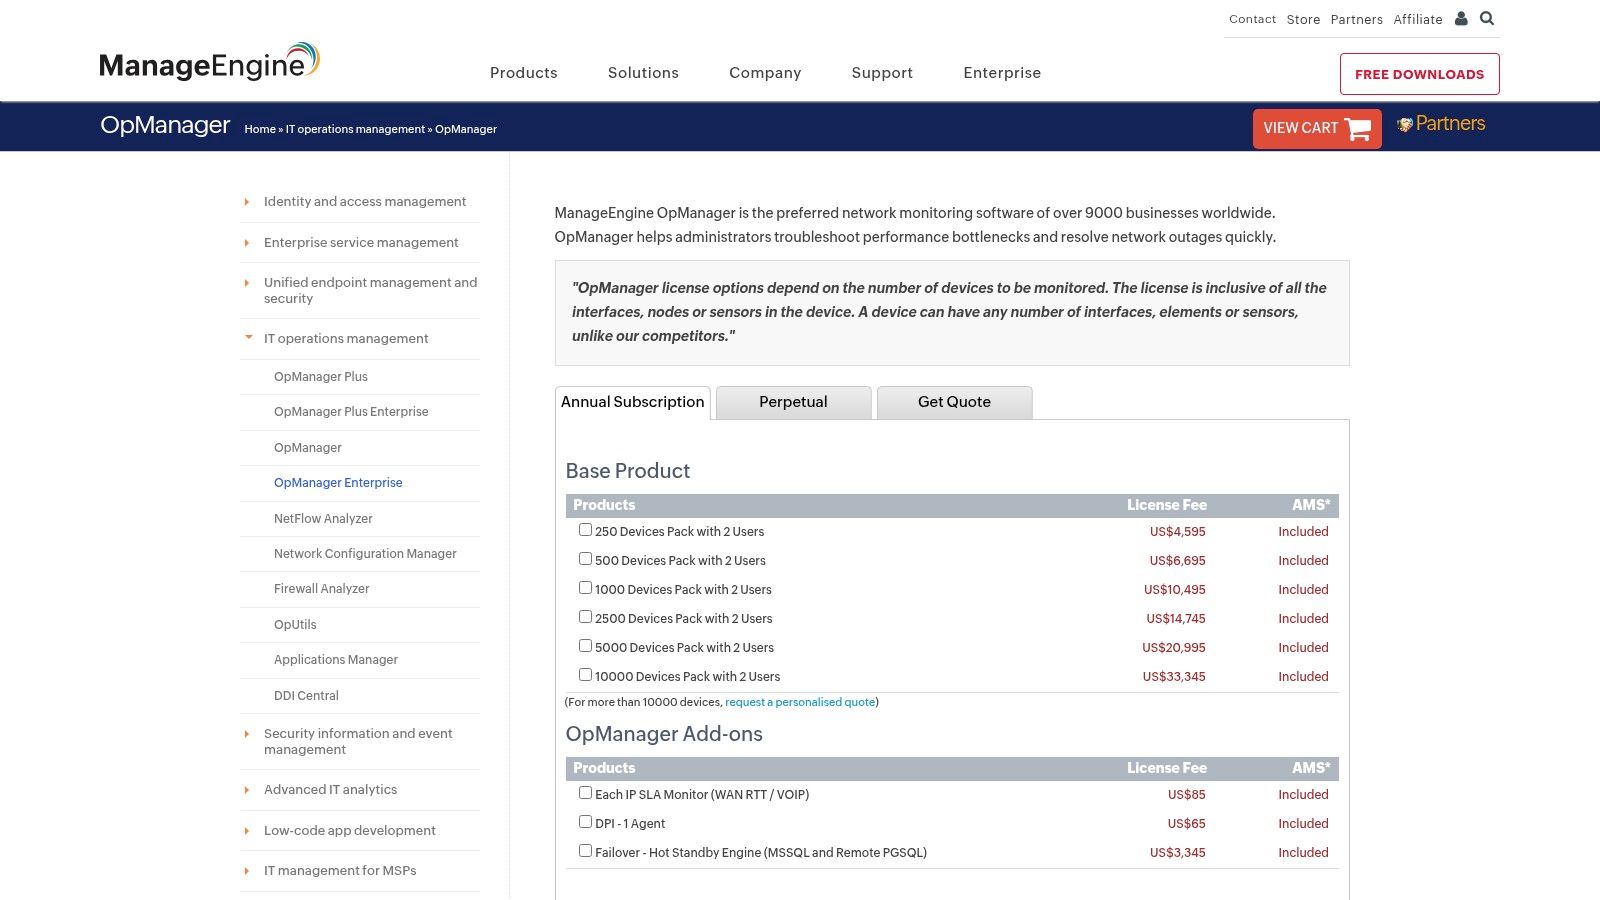
This model offers a cost-effective alternative to consumption-based SaaS platforms, especially for SMBs and Managed Service Providers (MSPs) with stable device counts. OpManager supports a wide range of protocols like SNMP, WMI, and CLI for broad compatibility. The platform is also highly extensible with add-ons for NetFlow analysis, configuration management (NCM), and IP address management (IPAM), allowing businesses to build a tailored solution that strengthens cybersecurity by tracking network changes.
Key Considerations
- Deployment: Deployed on-premise on Windows or Linux servers, giving you full control over your data and infrastructure security.
- Use Case: Ideal for budget-conscious IT teams, MSPs, and businesses that need a feature-rich, self-hosted solution with predictable, device-based costs and strong security controls.
- Pricing: Offers both perpetual and subscription licensing based on the number of devices. This transparent model avoids unexpected costs and is easy to budget for.
| Pros | Cons |
|---|---|
| Competitive entry pricing and clear device-based model | UI depth can require more initial setup time |
| Broad protocol support and many add-ons | Advanced analytics less automated than premium SaaS peers |
| Perpetual and subscription licensing options | Requires dedicated server resources for hosting and maintenance |
Website: https://store.manageengine.com/opmanager/subscription.html
5. Paessler PRTG
Paessler PRTG is one of the most established and user-friendly network monitoring tools, making it a favorite among SMBs and seasoned IT professionals alike. It operates on a straightforward, sensor-based model where a "sensor" is a single monitored aspect of a device, like CPU load, port traffic, or disk space. This approach simplifies licensing and makes it easy to understand exactly what you are monitoring across your servers, switches, and applications. PRTG excels at providing a unified view of your entire IT infrastructure.
The platform’s strength lies in its simplicity and comprehensive out-of-the-box capabilities. Its auto-discovery feature quickly maps your network, saving significant setup time, and its customizable dashboards and alerting system keep you informed of potential issues. PRTG is a powerful, all-in-one solution for businesses that want deep visibility without the complexity often associated with enterprise-grade observability platforms, providing a solid foundation for cybersecurity monitoring.
Key Considerations
- Deployment: PRTG can be deployed on-premise on a Windows server (PRTG Network Monitor) or used as a cloud-based SaaS solution (PRTG Hosted Monitor).
- Use Case: Ideal for organizations that need a comprehensive, agentless monitoring solution primarily for on-premise and hybrid infrastructure, with a clear and predictable pricing structure.
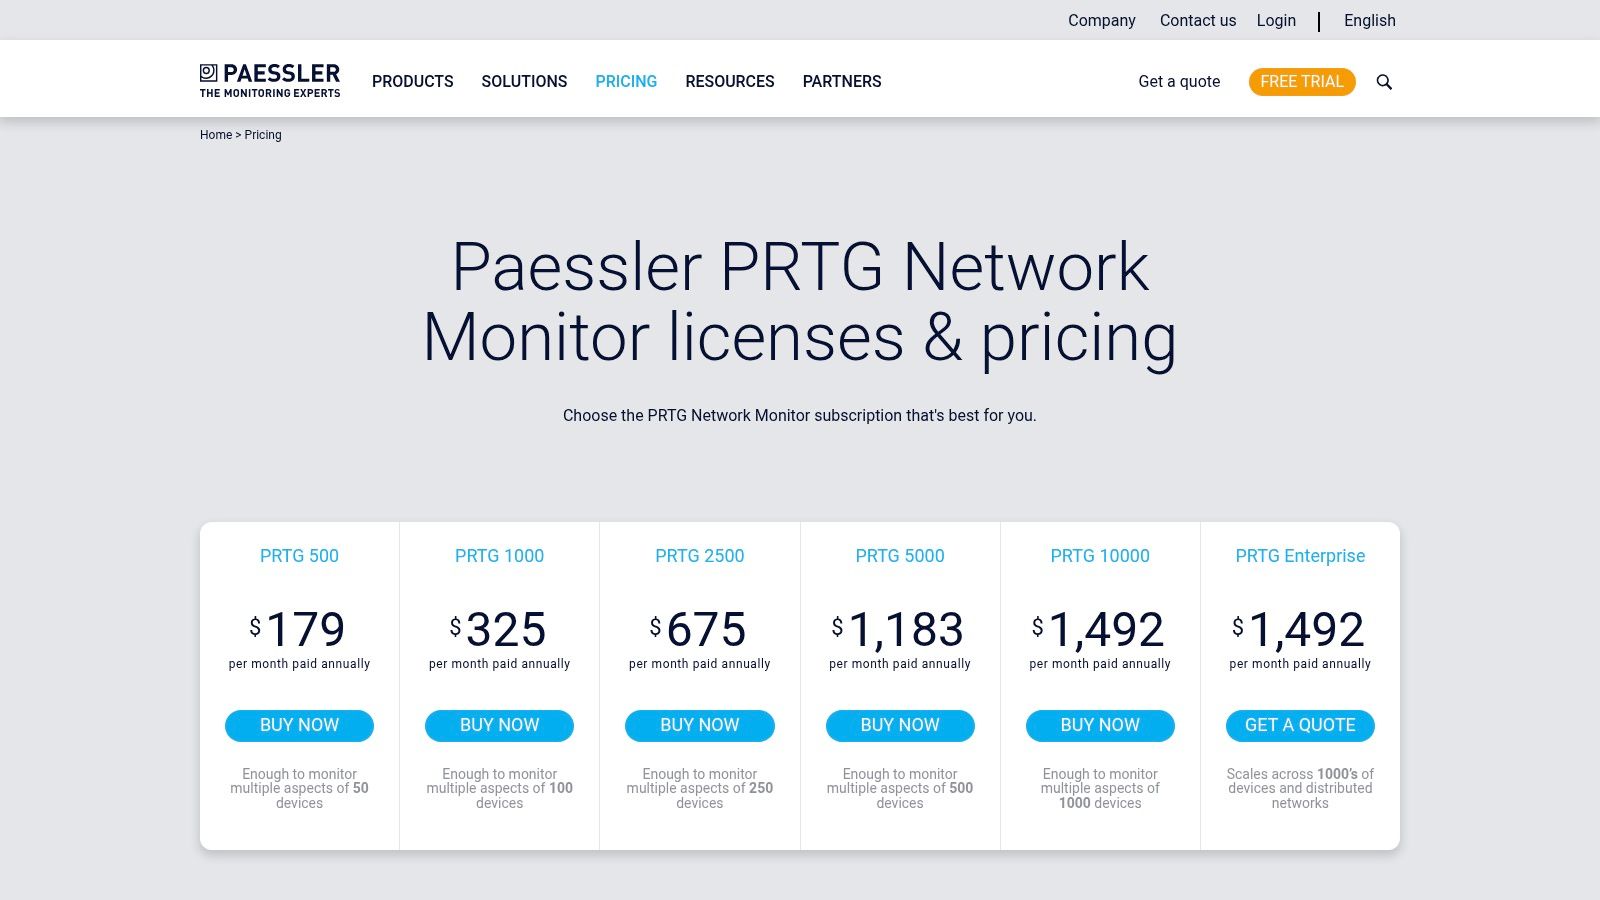
- Pricing: Licensing is based on the number of sensors. A free version is available for up to 100 sensors, with paid tiers scaling up to unlimited sensors for large enterprise environments.
| Pros | Cons |
|---|---|
| Transparent sensor-based pricing is easy to budget | Sensor count can grow quickly, requiring careful planning |
| Powerful auto-discovery and mapping features | Lacks the advanced AIOps of broader observability suites |
| All-in-one software with no add-ons required | Interface can feel dated compared to modern SaaS tools |
To get the most out of PRTG without dedicating your internal team, our managed server and network infrastructure services can handle the deployment, configuration, and ongoing monitoring for you.
Website: https://www.paessler.com/pricing
6. Site24x7
Site24x7, from Zoho Corporation, is a cloud-first observability platform offering a consolidated solution for website, server, network, and application performance monitoring. It stands out as one of the best network monitoring tools for SMBs and mid-market companies due to its straightforward pricing and rapid deployment. The platform provides a unified view, allowing businesses to monitor everything from network device performance and traffic flows with NetFlow analysis to server health and user experience, all from a single pane of glass.
This all-in-one approach is particularly beneficial for organizations seeking to simplify their IT monitoring stack without sacrificing depth. Site24x7's network monitoring module supports over 11,000 device models from more than 450 vendors, offering features like Network Configuration Management (NCM) and rapid polling down to 30 seconds. Its transparent pricing and AI-powered alerting make it an accessible yet powerful choice for businesses that need comprehensive oversight of their cloud solutions without a complex procurement process.
Key Considerations
- Deployment: As a SaaS platform, setup is agent-based and incredibly fast. You can start monitoring your network devices and cloud servers in minutes.
- Use Case: Ideal for SMBs, mid-market enterprises, and MSPs looking for a comprehensive, easy-to-use cloud monitoring platform with predictable, transparent costs and AI features.
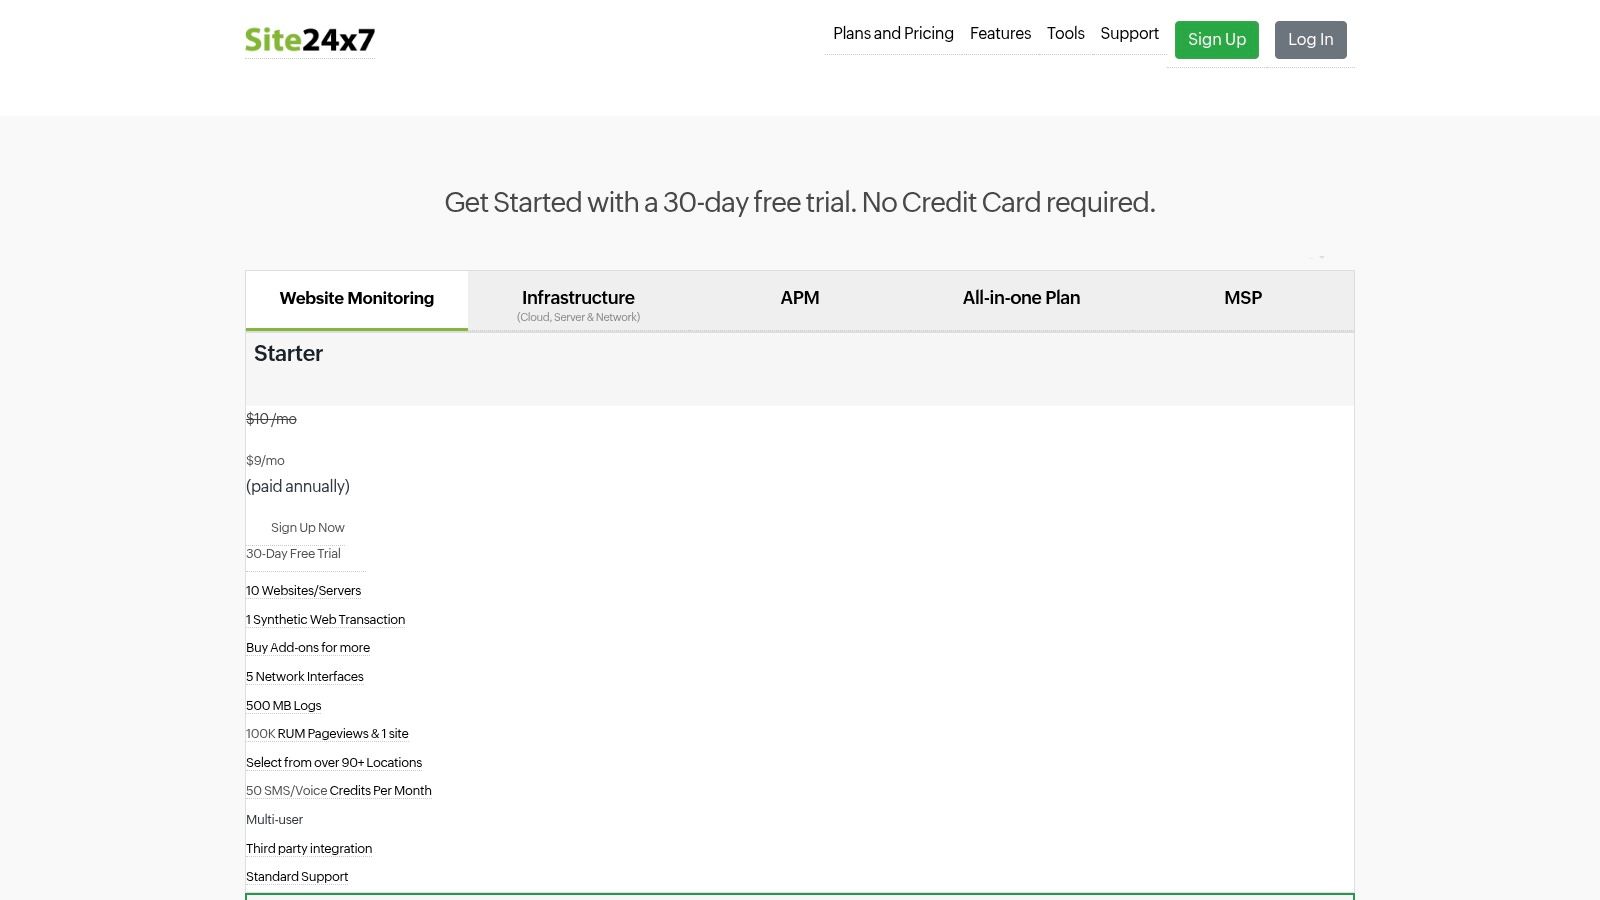
- Pricing: Features clear, publicly listed pricing tiers with a generous 30-day free trial. Add-ons for network interfaces and NetFlow are priced per unit, allowing for scalable growth.
| Pros | Cons |
|---|---|
| Very clear public pricing and add-on rates | Very large enterprises may find base plans limiting |
| Fast setup and broad coverage in one platform | Deep packet analysis capabilities are not in scope |
| AI-powered alerting and cloud-native focus | Focus is on breadth rather than specialized depth |
Website: https://www.site24x7.com/pricing.html
7. Auvik
Auvik is a cloud-based network management platform designed for rapid deployment and ease of use, making it one of the best network monitoring tools for Managed Service Providers (MSPs) and businesses with distributed IT environments. Its core strength lies in its powerful, automated network discovery and real-time topology mapping. Auvik simplifies complex network visibility by automatically identifying, documenting, and visualizing every device connected to the network, providing instant clarity without manual configuration.
This focus on automation extends to configuration backup and management, alerting IT teams to changes and enabling quick restoration. For MSPs or companies managing multiple sites, its multi-tenant architecture is a significant advantage, allowing for centralized control and monitoring across disparate client networks from a single dashboard. This streamlined approach helps reduce the cybersecurity risks associated with unmanaged or misconfigured devices by ensuring nothing is overlooked.
Key Considerations
- Deployment: Auvik is a SaaS platform. Deployment involves installing a lightweight collector on a single device within each network, which then handles the discovery and data relay.
- Use Case: Ideal for MSPs and IT departments managing multiple locations who need fast time-to-value, automated documentation, and streamlined network management to secure their cloud-connected infrastructure.
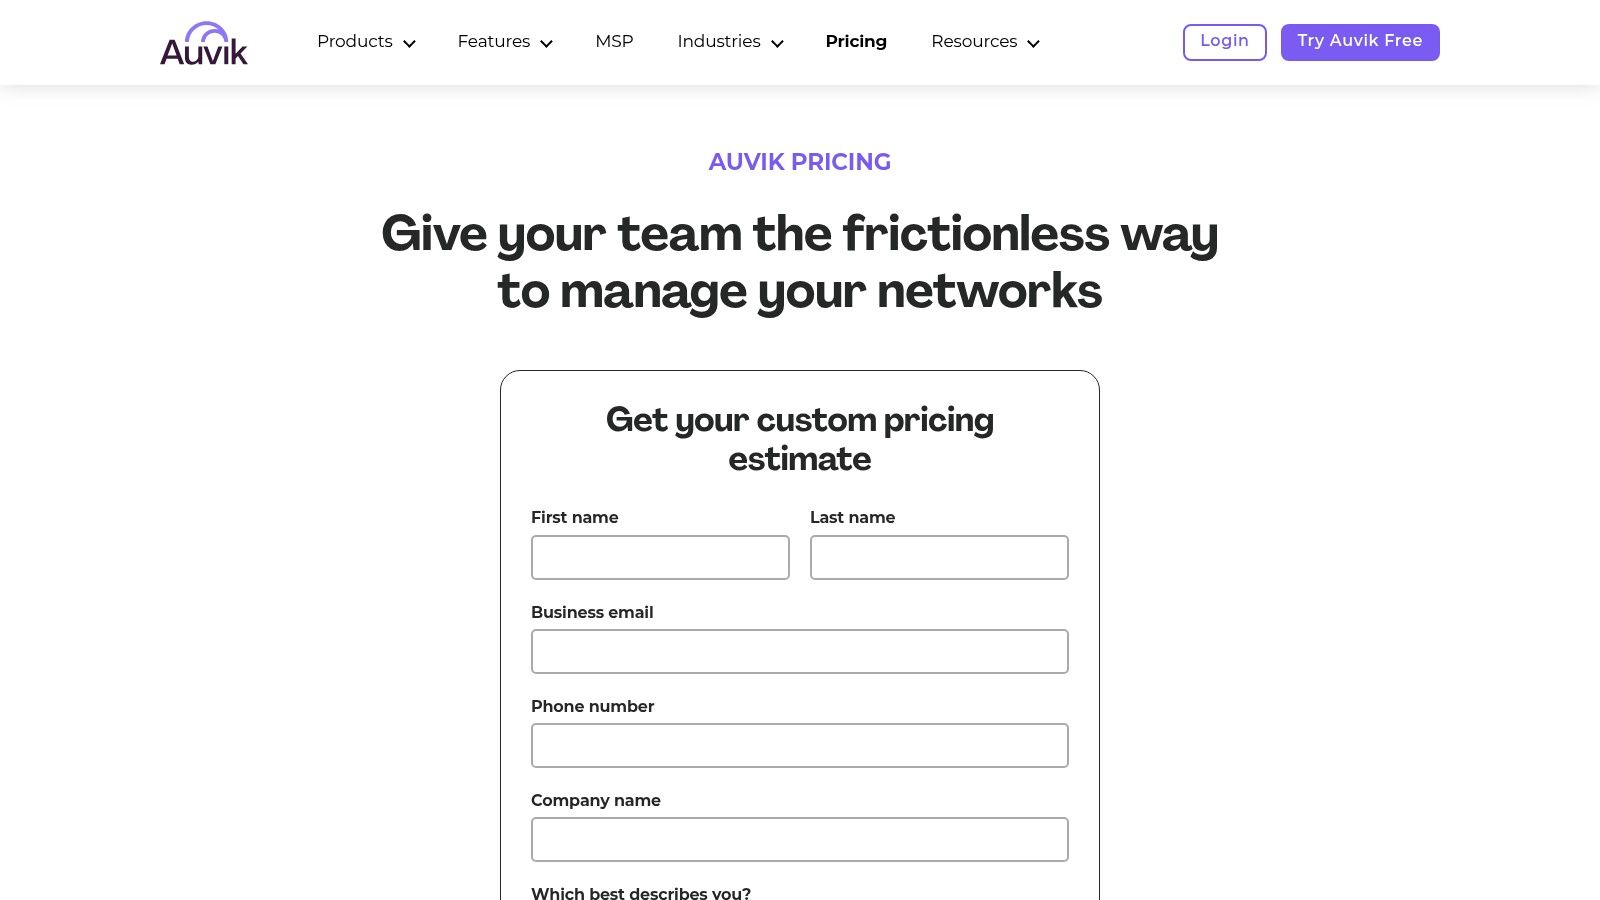
- Pricing: Pricing is customized and quote-based. It is typically calculated per billable network device (like routers, switches, and firewalls), with a free trial available.
| Pros | Cons |
|---|---|
| Extremely fast time-to-value with automated mapping | SaaS-only; no option for a self-hosted deployment |
| Strong MSP workflows and multi-tenant support | Pricing is not transparent and requires a sales call |
| Simple per-device billing model | Primarily focused on network management and mapping |
Website: https://www.auvik.com/pricing/
8. Progress WhatsUp Gold
Progress WhatsUp Gold is a long-standing, traditional network monitoring solution that appeals to IT teams preferring an on-premise, self-hosted deployment. It provides some of the best network monitoring tools for organizations that manage physical infrastructure and value clear, device-based licensing. Its key differentiator is its interactive network mapping, which automatically discovers and visualizes your entire environment, providing an intuitive, at-a-glance status of network health and device dependencies.
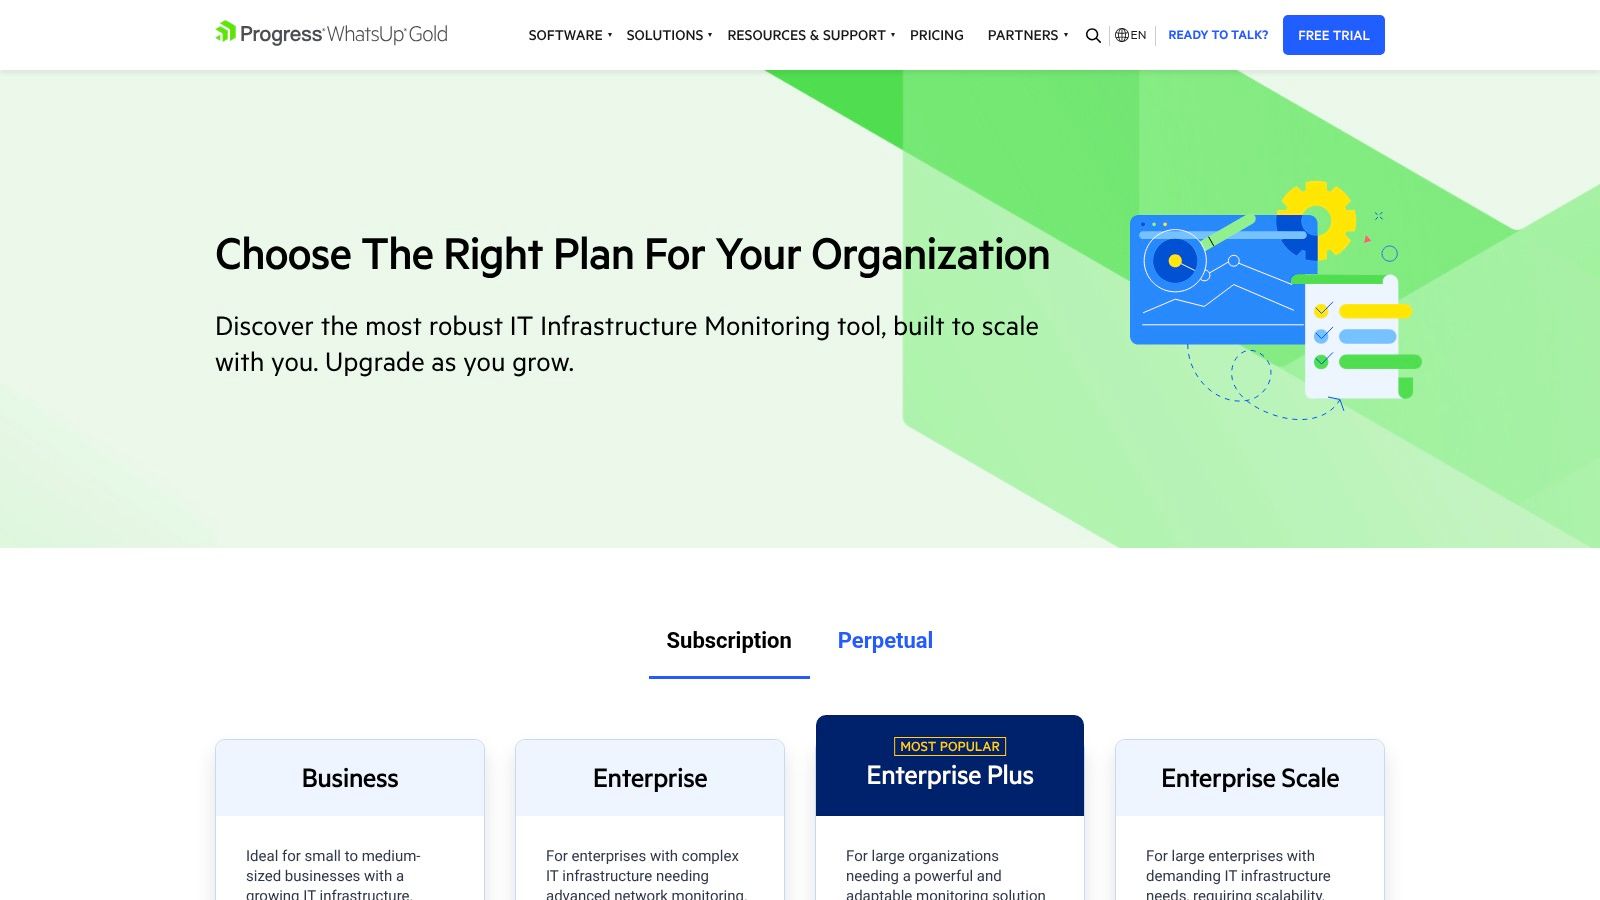
This tool is well-suited for SMBs in regions like Western Pennsylvania and Eastern Ohio that manage a significant on-site server and computer footprint. Unlike cloud-native platforms, WhatsUp Gold gives organizations complete control over their monitoring data, which can be a critical factor for compliance and cybersecurity strategies. With tiered editions and options for both subscription and perpetual licensing, it offers predictable budgeting and a feature set that grows with your needs, from basic monitoring to advanced flow analysis for cloud traffic.
Key Considerations
- Deployment: Requires a dedicated Windows Server for installation. Deployment is managed entirely in-house, giving you full control over security and data.
- Use Case: Ideal for organizations with established on-premise infrastructure that need deep visibility into device performance, availability, and network traffic without relying on a SaaS provider.
- Pricing: Tiered editions (Business, Enterprise, etc.) are based on device count, with published starting prices available. Perpetual and subscription licenses are offered, providing budget flexibility.
| Pros | Cons |
|---|---|
| Clear edition matrix and published starting prices | Focused on classic monitoring, not full-stack observability |
| Familiar on-prem deployment and workflows | Scaling for large estates requires careful HA planning |
| Good for teams standardizing on per-device licensing | User interface can feel less modern than cloud-native tools |
Website: https://www.whatsupgold.com/editions
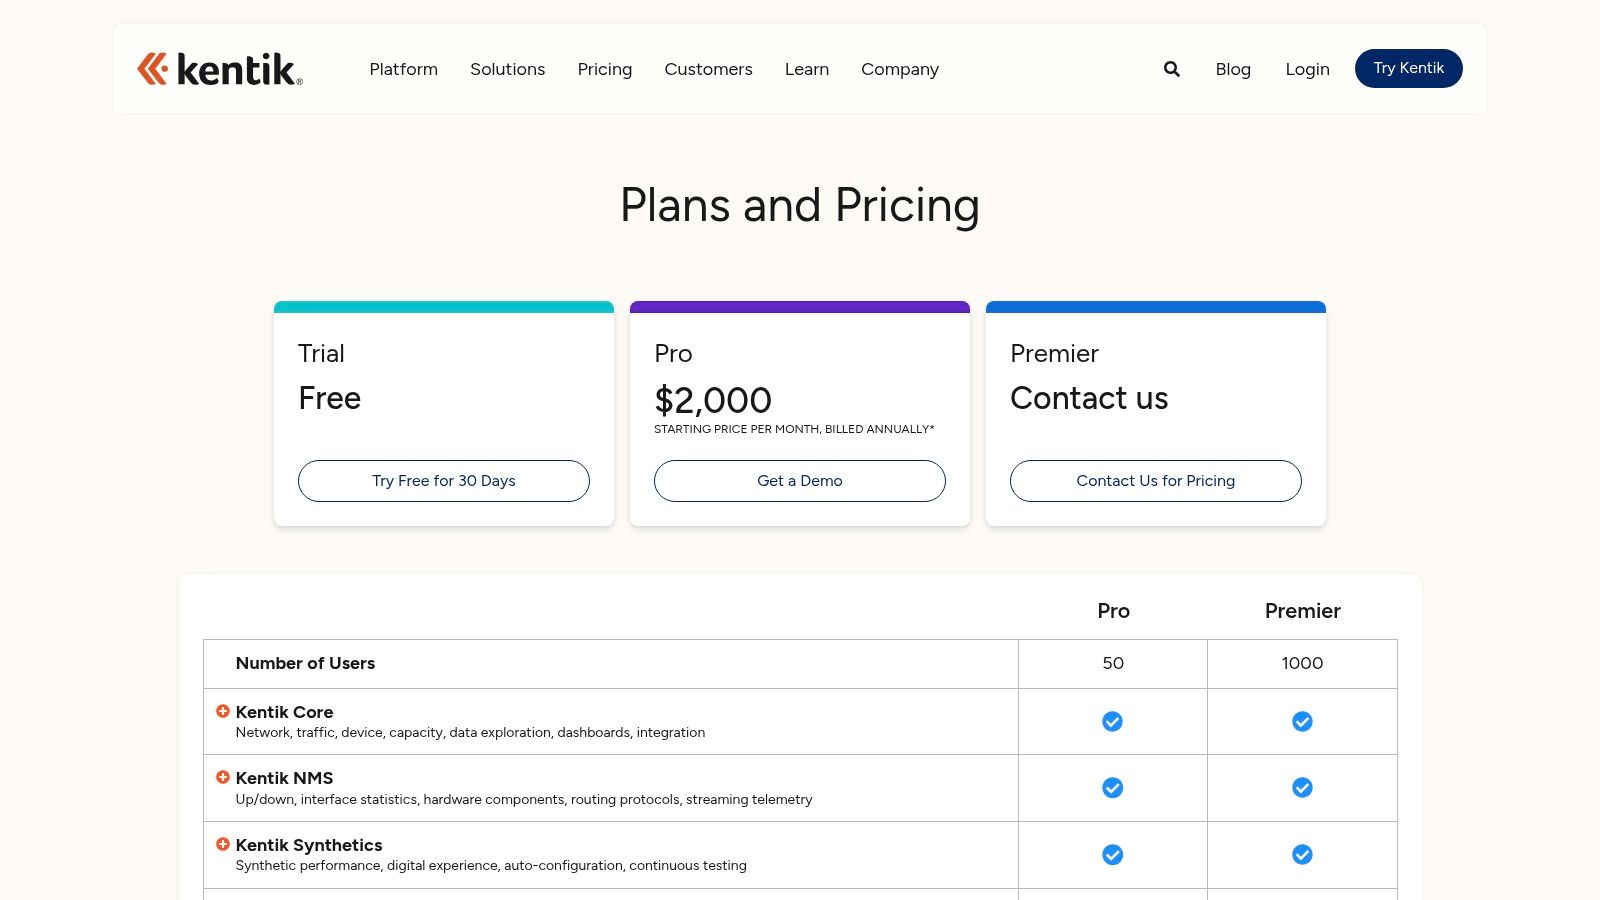
9. Kentik
Kentik is a SaaS-based network intelligence platform that provides deep, real-time analytics by ingesting vast amounts of network data. It stands out by focusing on high-scale traffic analysis using sources like NetFlow, IPFIX, and sFlow, making it one of the best network monitoring tools for organizations with complex traffic patterns. Unlike all-in-one observability platforms, Kentik offers a network-centric view, excelling at DDoS detection, BGP routing analysis, and cloud traffic forensics.
This specialized focus makes it a powerful choice for internet service providers, cloud-native companies, and large enterprises that need to understand traffic at the peering edge or across multi-cloud environments. Its robust visualization and querying engine allows network engineers to quickly drill down into specific traffic flows to troubleshoot performance issues or investigate security anomalies. The platform's ability to correlate flow data with synthetic tests and cloud provider metrics delivers a comprehensive picture of network health.
Key Considerations
- Deployment: As a SaaS solution, setup involves configuring your network devices and cloud accounts to export telemetry data to the Kentik platform. This is a configuration-heavy process rather than an agent-based one.
- Use Case: Ideal for organizations where the network itself is the core product or a critical performance component, such as ISPs or businesses with significant cloud and edge footprints needing deep traffic visibility for security and performance.
- Pricing: Kentik offers Pro and Premier editions based on annual contracts. Pricing is customized and generally higher than typical SMB tools, reflecting its enterprise-grade, high-volume data processing capabilities.
| Pros | Cons |
|---|---|
| Specialized network-centric analytics at massive scale | Higher starting price point not geared for small SMBs |
| Powerful DDoS detection and traffic forensics | Annual contracts are standard |
| Robust BGP and peering/edge analysis capabilities | Advanced features are often sold as separate add-on modules |
Website: https://www.kentik.com/product/plans-pricing/
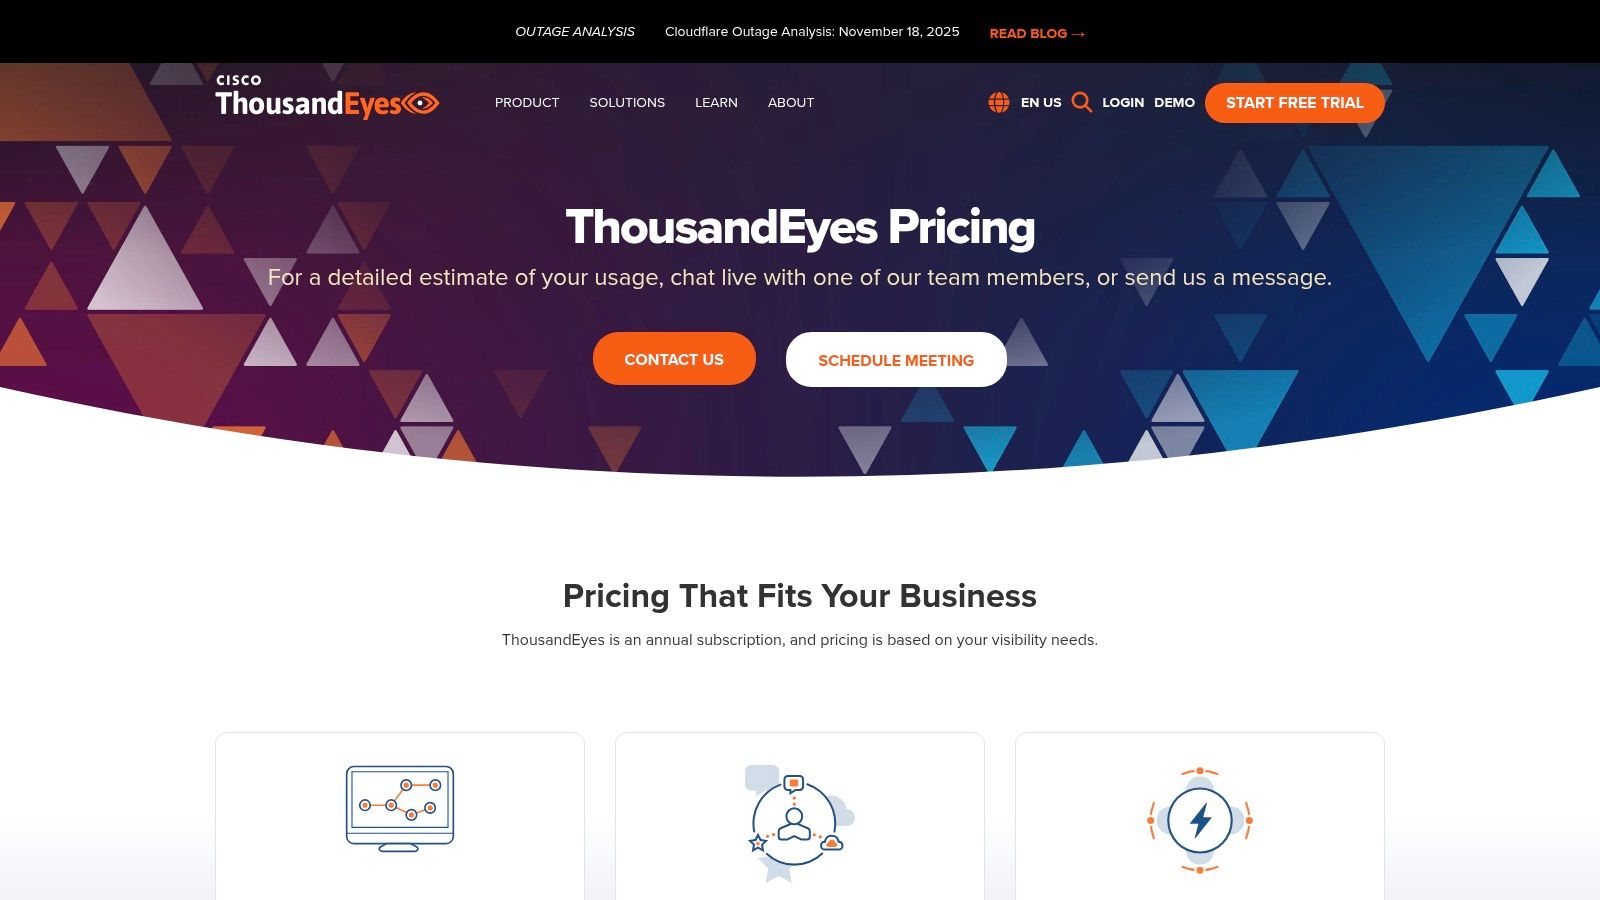
10. Cisco ThousandEyes
Cisco ThousandEyes is a SaaS-based digital experience monitoring platform that provides unparalleled visibility into the internet, WAN, and cloud. It excels where traditional network monitoring tools fall short by mapping the entire service delivery path from the user to the application, regardless of where either is located. This makes it one of the best network monitoring tools for businesses heavily reliant on SaaS applications, cloud services, and complex wide-area networks (WAN). By using global vantage points and endpoint agents, it diagnoses issues beyond your corporate perimeter.
This external, outside-in perspective is crucial for troubleshooting performance problems with services like Microsoft 365 or Salesforce, where the problem often lies with an ISP or transit provider. ThousandEyes provides deep insights through synthetic monitoring, BGP route visualization, and end-user experience data. This helps IT teams pinpoint the exact location and cause of an outage or slowdown, reducing mean time to resolution and proving when the issue is not on the internal network.
Key Considerations
- Deployment: Entirely SaaS-based. Deployment involves configuring tests from ThousandEyes' global Cloud Agents or deploying lightweight Enterprise and Endpoint Agents inside your network or on user devices.
- Use Case: Ideal for organizations that need to monitor the performance of business-critical cloud solutions, troubleshoot WAN connectivity, or secure the end-user experience for remote workers.
- Pricing: ThousandEyes uses a flexible, consumption-based units model where you purchase capacity to run various tests. Pricing is primarily quote-based and tailored for enterprise needs.
| Pros | Cons |
|---|---|
| Excellent Internet path and BGP visibility for SaaS/WAN | Pricing is enterprise-oriented and primarily available by quote |
| Enterprise-grade support and deep Cisco integration options | Focuses on synthetics and path visibility, not broad on-prem polling |
| Flexible units model allows for customized test allocation | Can be complex to configure without a clear monitoring strategy |
Website: https://www.thousandeyes.com/pricing/
11. Nagios XI
Nagios XI is the commercial enterprise version of the open-source Nagios Core, offering a powerful and highly extensible monitoring solution. It builds upon its open-source foundation by providing a user-friendly GUI, configuration wizards, and advanced reporting capabilities, making it one of the best network monitoring tools for teams that prefer self-hosted control and a one-time licensing model. Its strength lies in its vast ecosystem of community-developed plugins, allowing it to monitor virtually any device or service imaginable.
This makes Nagios XI a strong contender for organizations with skilled IT teams that value deep customization and control over their monitoring environment. The platform is designed for proactive problem resolution, with features like capacity planning graphs and infrastructure management dashboards that help administrators identify potential security and performance issues before they impact end-users. It offers a clear, node-based perpetual license, which is ideal for businesses that prefer a CAPEX spending model over recurring SaaS subscriptions for cloud services.
Key Considerations
- Deployment: Deployed on-premises on your own hardware or in a private cloud, giving you full control over data and security. A free version is available for monitoring up to seven nodes.
- Use Case: Excellent for organizations that need a highly customizable, self-hosted solution and have the technical expertise to manage and extend it. It is particularly well-suited for monitoring complex, heterogeneous, and cloud-connected environments.
- Pricing: Nagios XI uses a perpetual, per-node licensing model with Standard and Enterprise editions. This one-time cost can be very attractive for budget-conscious teams looking to avoid monthly fees.
| Pros | Cons |
|---|---|
| One-time licensing attractive for CAPEX-focused teams | Requires admin skill to extend and customize at scale |
| Highly extensible with a strong community plugin ecosystem | UI and workflows are traditional compared to newer SaaS tools |
| Clear, predictable node-based pricing ladder | Lacks the native cloud-integrated feel of modern platforms |
Website: https://www.nagios.com/products/nagios-xi/
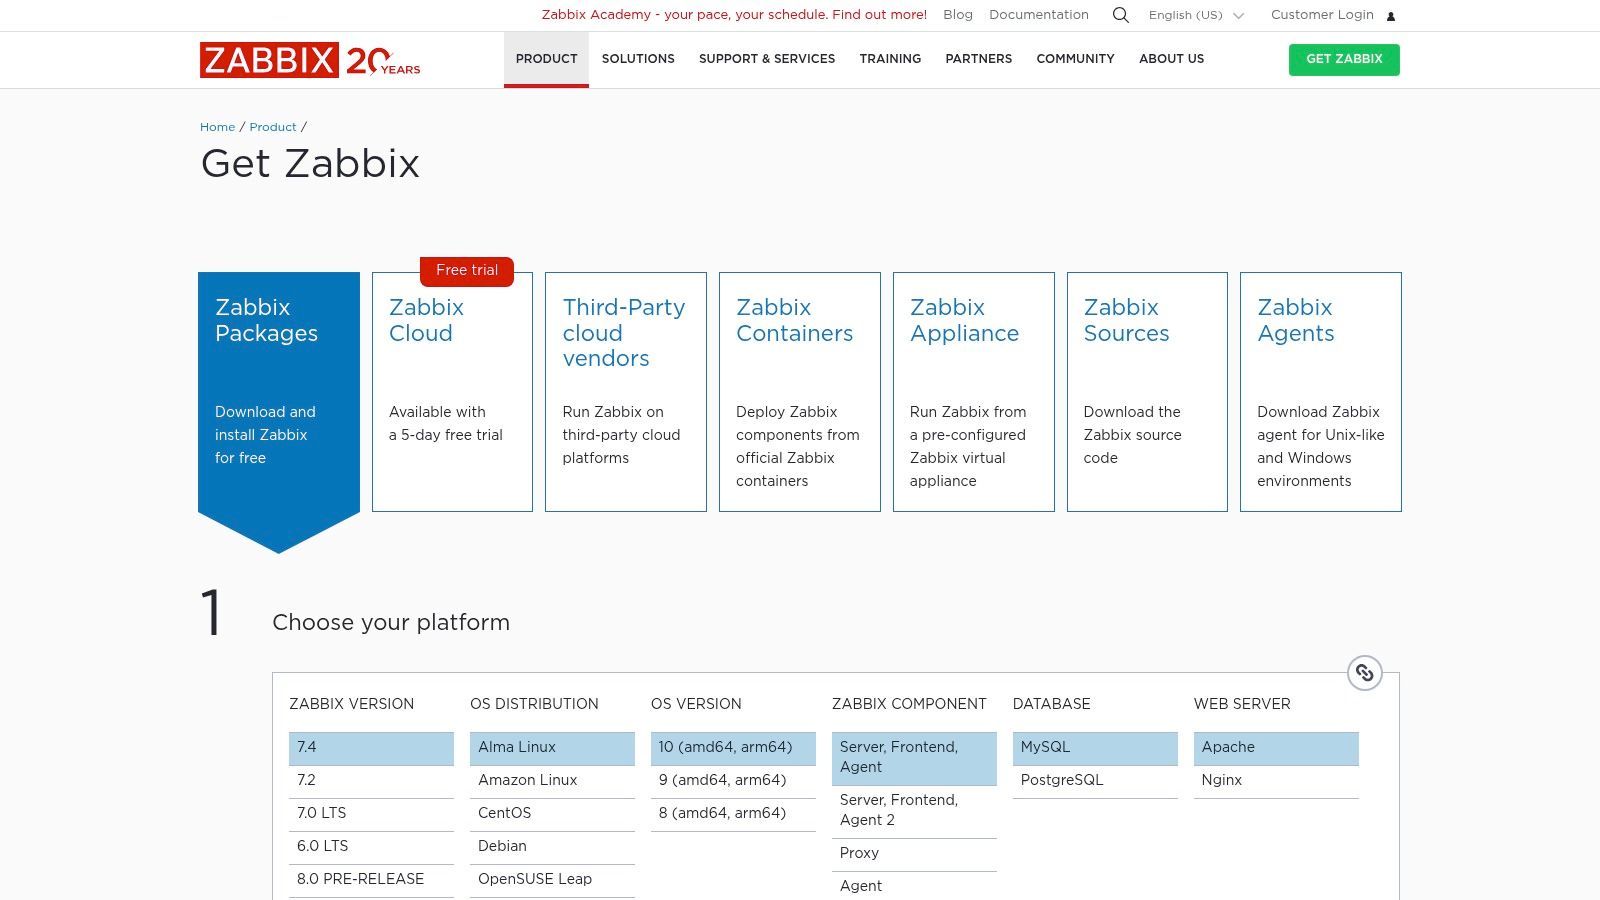
12. Zabbix
Zabbix is a powerful, enterprise-grade open-source monitoring solution that offers immense flexibility for organizations with in-house technical expertise. As one of the most respected free and best network monitoring tools, it provides a single platform to monitor everything from network devices and servers to applications and cloud services. Its strength lies in its limitless customization, allowing DevOps and Linux-savvy teams to tailor the monitoring environment precisely to their needs without any software licensing fees.
The platform includes robust features like auto-discovery of network devices, a flexible templating system to standardize monitoring configurations, and advanced problem detection. This makes it an ideal choice for budget-conscious SMBs in regions like Western Pennsylvania and Eastern Ohio that have the skilled personnel to manage a self-hosted solution. While the core software is free, Zabbix offers optional commercial support, training, and certified integrations for businesses needing an extra layer of assurance for their cybersecurity posture.
Key Considerations
- Deployment: Requires self-hosting on your own infrastructure (on-premise or cloud). This involves setting up the Zabbix server, database, and web front end, demanding significant DevOps or sysadmin skills.
- Use Case: Best suited for cost-controlled organizations with strong internal IT capabilities that require a highly customizable monitoring tool for a diverse range of network devices, servers, and cloud solutions.
- Pricing: The software is completely free under an open-source license. Costs are associated with the infrastructure required to run it, internal staff time for management, and optional paid support tiers.
| Pros | Cons |
|---|---|
| No software license fees and highly customizable | Requires significant self-hosting and DevOps/DBA expertise |
| Active community and frequent, robust releases | Enterprise features require manual configuration vs. turnkey |
| Strong auto-discovery and templating capabilities | Can have a steep learning curve for those new to the platform |
Website: https://www.zabbix.com/download
Top 12 Network Monitoring Tools Comparison
| Product | Core focus | Deployment & licensing | Key strengths | Best for | Pricing & trials |
|---|---|---|---|---|---|
| Datadog | Cloud observability (infra, APM, logs, network, synthetics) | SaaS, modular product-based pricing | 1,000+ integrations; correlated logs/traces; mature dashboards | Cloud-first teams, enterprises, fast pilots | Granular pricing, easy free trial; can be costly at scale |
| LogicMonitor | Hybrid observability with AI-assisted alerting | SaaS, agentless; tiered Hybrid Units pricing | AI anomaly detection; broad coverage; 3,000+ integrations | Hybrid environments needing predictable tiers | Published starting prices; must map Hybrid Units; higher-tier AI add-ons |
| SolarWinds (NPM & Observability) | Network performance monitoring + full‑stack observability options | SaaS or self-hosted; per-device/host pricing | NetPath/PerfStack, advanced mapping, mature network tools | Network teams preferring on‑prem or SaaS choice | Per‑device pricing, 30‑day trials, volume discounts |
| ManageEngine OpManager | On‑prem network monitoring & device management | Self‑hosted; device-based licensing; perpetual or subscription | Competitive entry price; broad protocol support; many add‑ons | Budget-conscious IT teams and MSPs | Clear device pricing; cost-effective entry-level |
| Paessler PRTG | Sensor-based monitoring (devices, interfaces, services) | Self‑hosted or hosted; sensor-based licensing | Auto-discovery, maps, robust probes/templates | SMBs and teams wanting transparent sensor model | Sensor tiers (500–10k); easy pilot but requires sensor planning |
| Site24x7 | Cloud-first consolidated monitoring (web, servers, network, APM) | SaaS with public pricing and MSP plans | Fast setup; clear public pricing; MSP features | SMBs to mid‑enterprise and MSPs | Transparent public pricing; 30‑day free trial |
| Auvik | SaaS network monitoring & management for MSPs | SaaS only; per-device licensing (quote) | Automated discovery, topology maps, MSP multi‑tenant | MSPs and distributed network environments | Custom pricing via quote; simple per‑device billing |
| Progress WhatsUp Gold | Traditional on‑prem network monitoring with flow/map features | Self‑hosted; device-count licensing; subscription or perpetual | Clear editions; map-based monitoring; published start prices | Teams standardizing on device counts and on‑prem deployments | Published starting prices; reseller options; perpetual available |
| Kentik | Network intelligence & high-scale flow analytics | SaaS; edition-based with retention options | NetFlow/IPFIX analytics, DDoS & peering analysis, rich forensics | ISPs, cloud-first orgs, large enterprises | Higher starting price; annual contracts and add-ons |
| Cisco ThousandEyes | Internet/WAN visibility, synthetics and BGP/path insight | SaaS; units model, quote‑based enterprise pricing | Global cloud agents; BGP routing context; path visualizations | Enterprises needing Internet path/BGP troubleshooting | Quote-based pricing with enterprise minimums |
| Nagios XI | Traditional monitoring with GUI, reporting and plugins | Self‑hosted; node-based perpetual licenses | One‑time licensing; large plugin ecosystem; extensible | CAPEX-minded teams and skilled admins | Node pricing ladder; free edition available for labs |
| Zabbix | Open‑source monitoring for network, servers and apps | Self‑hosted (AGPL); optional paid commercial support | No license fees; highly customizable; active community | Linux/devops teams and cost-conscious orgs | Free to use; paid support/training optional |
Beyond the Dashboard: Partnering for Proactive Network Management
As we wrap up our deep dive into the best network monitoring tools, it’s clear that selecting the right solution is only the first step. SMBs in Western Pennsylvania, Eastern Ohio organizations, and compliance-focused businesses all need a strategic approach that pairs technology with expert management. Whether you’re evaluating Datadog’s AI-driven analytics or SolarWinds’ rich observability features, your toolset must fit your unique requirements for cybersecurity, AI enablement, and cloud readiness.
Key Insights and Takeaways
Real-world performance matters:
Every tool on our list—from Auvik’s automated topology mapping to Paessler PRTG’s customizable sensors—shines in specific environments. Match features like AI anomaly detection or cloud monitoring to your existing infrastructure.Balance cost, scale, and compliance:
Pricing tiers vary widely. Free tiers in Nagios XI or Zabbix can suit lean budgets, while enterprise plans in LogicMonitor and Kentik deliver advanced threat detection for regulated industries.Integration is critical:
Look for native connectors to Azure, AWS, and SIEM platforms. Cloud-native tools like Site24x7 excel in hybrid environments, while on-prem solutions such as ManageEngine OpManager deliver granular SNMP insights.
“Proactive monitoring reduces mean time to detect by up to 70%, prevents outages, and strengthens your cybersecurity posture.”
Actionable Next Steps
Define your priorities
- List must-have features: AI-powered alerts, compliance reporting, cloud dashboards
- Establish performance thresholds and security SLAs
Pilot your shortlist
- Use free trials or community editions for 30 days
- Measure alert accuracy, ease of setup, and integration effort
Tune and expand
- Calibrate thresholds to reduce false positives
- Integrate with ticketing systems (Jira, ServiceNow)
- Automate remediation scripts for common network events
Leverage expert partnerships
- For organizations seeking comprehensive oversight, exploring dedicated network management services can provide the expertise and tools necessary for proactive network health.
Choosing the Right Tool for Your Needs
Small teams on a budget
- Nagios XI, Zabbix: strong open-source foundations, highly customizable
- Factor in internal staffing for maintenance and plugin management
Hybrid cloud environments
- Datadog, Site24x7: built-in cloud connectors, AI-driven anomaly detection
- Ideal for firms leveraging AWS, Azure, or Google Cloud
Compliance-driven enterprises
- SolarWinds NPM, LogicMonitor: advanced reporting, audit-ready dashboards
- Ensure GDPR, HIPAA, or PCI DSS templates are included
Rapid deployment and automation
- Auvik, Paessler PRTG: zero-touch deployment, auto-discovery, automated alert workflows
- Suitable for companies scaling quickly or operating multiple sites
Important Implementation Considerations
- Alert fatigue prevention
- Group related events, use AI to correlate anomalies, schedule maintenance windows
- Training and documentation
- Allocate time for IT staff onboarding, create runbooks for escalation paths
- Ongoing review
- Quarterly audits of dashboard metrics, adjust thresholds and sensor counts
- Cybersecurity integration
- Feed network alerts into your SIEM, apply behavioral analytics from AI-powered dashboards
By combining the right best network monitoring tools with a guided strategy, you empower your team to move from reactive firefighting to proactive optimization. Continuous tuning, regular audits, and AI-driven insights turn raw data into actionable intelligence—fueling security, resilience, and growth.
Embrace this next chapter in network monitoring and transform your infrastructure into a strategic asset that drives business success.
Ready to turn monitoring into a proactive engine for growth? Partner with Eagle Point Technology Solutions for expert deployment, 24/7 alert management, and AI-driven insights. Visit Eagle Point Technology Solutions to learn how we can help you maximize the value of the best network monitoring tools.