IT infrastructure performance metrics are the vital signs that tell you how healthy, fast, and reliable your business's technology is. Think of them as the gauges on your company's dashboard—they don't just tell you if things are working, but how well they're working. This directly impacts everything from your team's productivity to your customers' satisfaction.
Why Performance Metrics Are Your Business's Health Check

For many business leaders here in Western Pennsylvania and Eastern Ohio, IT can feel like a black box. You know it's critical, but you only really notice it when something breaks. This reactive "break-fix" cycle isn't just stressful; it's expensive, leading to unexpected downtime, frustrated employees, and lost revenue.
Tracking key performance metrics changes the entire game. It lets you shift your approach from reactive to proactive. It’s less about getting bogged down in technical jargon and more about truly understanding how your technology is driving your business forward.
The Delivery Truck Analogy
Here’s a simple way to think about it: imagine your IT infrastructure is a fleet of delivery trucks for your manufacturing or distribution business. These trucks transport everything that matters—customer data, internal communications, sales orders, and project files.
Now, ask yourself these questions about your fleet:
- Is the truck reliable enough to make all its deliveries on time (Availability)?
- How fast does it get from your office to the customer (Latency)?
- How much cargo can it carry in a single trip (Throughput)?
- How often does cargo get lost or damaged along the way (Error Rate)?
Answering these questions with hard data—not just gut feelings—is the whole point of monitoring IT infrastructure performance. You wouldn't run a logistics company without tracking your trucks, and you shouldn't run your business without monitoring the technology that powers it.
From Technical Data to Business Resilience
This proactive mindset is catching on everywhere. The global market for IT infrastructure monitoring swelled to $24.80 billion in 2023, largely because so many companies are moving to the cloud. With 60% of all corporate data now cloud-based, keeping a constant eye on performance is the only way to prevent costly disruptions.
Ultimately, tracking performance is about turning your technology from a potential liability into a genuine competitive advantage. It helps you make smarter decisions, allocate your budget more effectively, and ensure your systems can actually support your growth. To truly assess your business's health, it’s worth digging deeper into mastering digital performance metrics, which is a critical piece of your overall operational well-being.
Understanding The Four Pillars of IT Performance

Before you can start fixing problems or making smart upgrades, you need a solid framework for what "good" performance actually means. Like any sturdy building, a healthy IT environment stands on four fundamental pillars. Getting a handle on these core IT infrastructure performance metrics gives you the language and insight to see what’s really going on with your technology.
Don’t think of these as overly technical terms. Instead, see them as direct answers to simple business questions you probably ask every day. They have a real, tangible impact on how your team works, how customers see you, and ultimately, your bottom line.
Pillar 1: Availability
The first and most critical pillar is Availability, which most people know as uptime. It answers the most basic question of all: "Is everything on and working right now?" This metric tracks the percentage of time a server, network, or application is actually operational and accessible to your team and customers.
For a manufacturing business, high availability means the inventory system doesn't crash during a critical late-night shift. For a law firm, it’s your team being able to pull up client files without a hitch. Availability is the absolute bedrock of productivity—if the system is down, none of the other metrics matter.
Pillar 2: Latency
Next up is Latency, which is all about responsiveness. Think of it as the frustrating delay between when you do something and when you see the result. It answers the question, "How long do I have to wait after I click the button?"
We’ve all experienced this. It’s that awkward, conversation-killing pause on a video call. In a business setting, it’s the agonizing wait for a large file to open from the server or the spinning wheel a potential customer sees while your website loads. Low latency delivers a smooth, seamless experience; high latency kills productivity and sends customers running to your competitors.
Key Takeaway: While uptime (Availability) means your systems are running, low latency ensures they're actually usable. A server can be technically online but so sluggish that it's useless for getting any real work done.
Pillar 3: Throughput
Our third pillar is Throughput, which measures how much work your system can handle over a period of time. It answers the question, "How much can we get done at once before things start slowing down?"
Picture your network as a highway. Throughput is the number of cars that can smoothly pass a specific point every minute. For your business, this is about how many customer orders your e-commerce site can process during a flash sale, or how fast your critical nightly backup to the cloud finishes. Not enough throughput creates bottlenecks that grind your entire operation to a halt, especially as you grow.
Pillar 4: Error Rate
Finally, we have the Error Rate. This pillar keeps an eye on how often things are breaking or failing within your systems. It directly answers the question, "How often are things going wrong?"
Errors can be anything from a dropped VoIP call during a client pitch to a "404 Not Found" page hitting a potential customer. A rising Error Rate is a huge red flag for instability. It chips away at user trust and often points to deeper problems that could lead to a major outage if ignored. Tracking errors helps you stamp out small fires before they become infernos.
To help tie all this together, here’s a quick breakdown of what these pillars mean for your day-to-day operations.
Core IT Performance Metrics and Their Business Impact
| Metric | What It Measures | Why It Matters for Your Business |
|---|---|---|
| Availability | Is the system online and working? (Uptime %) | If it’s down, your team can't work, and customers can't buy. It directly impacts revenue and productivity. |
| Latency | How long is the delay for a response? (Response Time) | Slow systems frustrate everyone. High latency drives away customers and kills employee efficiency. |
| Throughput | How much work can the system handle at once? (Data/Time) | This determines your capacity for growth. Low throughput creates bottlenecks that slow down the entire business. |
| Error Rate | How often are things failing or breaking? (Failures/Time) | A high error rate signals instability and erodes trust. It’s an early warning sign of bigger problems to come. |
Grasping these four pillars gives you a complete, 360-degree view of your IT health. They're all interconnected, and you need all four to be strong to build a resilient and efficient technology foundation that truly supports your business goals.
Monitoring Your System and Server Health
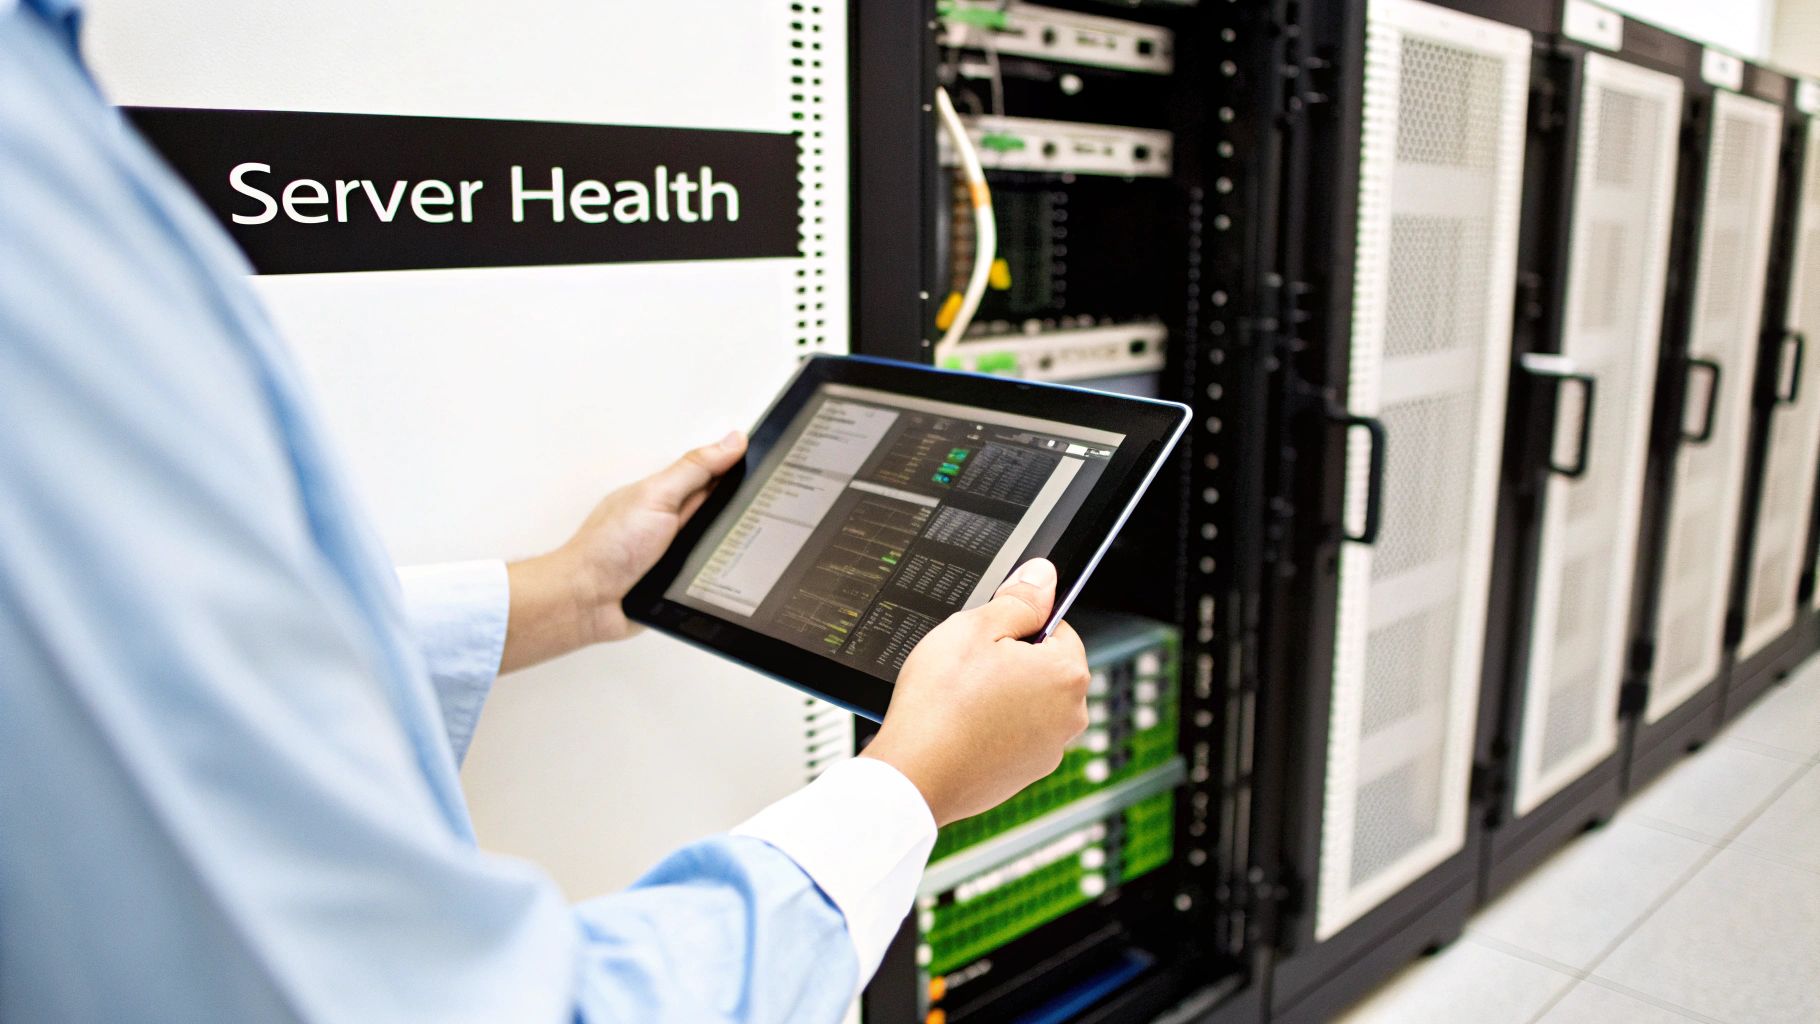
Alright, we've covered the four pillars. Now it's time to look under the hood at the engines that power your business every single day—your servers. It doesn't matter if they're physical machines humming away in a closet or virtual instances floating in the cloud; their health is a direct mirror of your company's ability to operate.
Ignoring these core system metrics is like driving with the check-engine light on. You might get where you're going for a while, but a breakdown isn't just possible, it's inevitable.
To make this simple, think of your server as a chef running a busy restaurant kitchen. For that kitchen to work, three things need to be in perfect sync: how fast the chef works, the workspace they have available, and how quickly they can grab ingredients. If any of those falter, orders pile up, customers get angry, and the whole operation grinds to a halt. Your servers operate the exact same way, and keeping an eye on them is a massive part of managing your overall IT infrastructure performance metrics.
CPU Utilization: The Chef's Speed
The Central Processing Unit (CPU) is your server's brain. CPU Utilization is the metric that tells you just how hard that brain is working at any given moment, usually shown as a percentage. It’s the perfect stand-in for our chef's speed and how well they're handling incoming orders. Low CPU utilization means the chef is relaxed, waiting for the next ticket. High utilization? That’s the middle of the dinner rush, with the chef going full tilt.
If that CPU utilization is consistently pegged at 100%, your server has zero gas left in the tank to handle new requests. This is when you see applications become unresponsive, processes freeze, and productivity completely nosedives.
SMB Pro Tip: You want to aim to keep your average CPU utilization below 75%. This leaves a healthy buffer to handle those unexpected surges, like when your entire team decides to run a complex report at the end of the month.
Memory Usage: The Available Counter Space
Memory (or RAM) is the server's short-term workspace. Think of it as the counter where the chef preps all the ingredients for the dishes they're actively making. Memory Usage simply tells you how much of that counter space is being used up. If the counter is cluttered and full, the chef has to waste time shuffling things around just to find room to chop vegetables, slowing everything down.
When your server completely runs out of memory, it's forced to use a piece of the much slower hard drive as "virtual memory." This process, known as swapping, is painfully slow and a dead giveaway that you've got performance problems. It's the digital version of your chef having to store half-prepped ingredients in the walk-in freezer between steps—clunky and inefficient.
Disk I/O: The Speed of Grabbing Ingredients
Finally, Disk Input/Output (I/O) measures how quickly your server can read data from or write data to its long-term storage (the hard drive or solid-state drive). This is all about the chef's ability to quickly grab ingredients from the pantry. High latency here means every time the chef needs something, they have to take a long, slow walk to a poorly organized stockroom.
This metric is absolutely critical for any business running database-heavy applications or file servers. Slow disk performance directly leads to sluggish application load times and agonizing waits for file transfers, creating daily friction for your team.
At Eagle Point, our approach to managed server and network infrastructure is built around this kind of proactive monitoring to keep your business running at its absolute best.
Monitoring Your Network Health
If your servers are the engines driving your business, your network is the highway system that ties everything together. It's the digital pavement connecting your employees to critical data and your company to its customers. When that highway is clear, information flows without a hitch. But just one traffic jam—a network bottleneck—can bring your entire operation to a screeching halt.
Suddenly, cloud software becomes sluggish, VoIP calls drop, and accessing essential files feels impossible. This is why keeping a close eye on the right network metrics is so important. Think of it as having a traffic controller's dashboard, giving you a real-time view of congestion before it causes a major pile-up. It’s about much more than just internet speed; it’s about the quality and stability of the connections your business relies on every single minute.
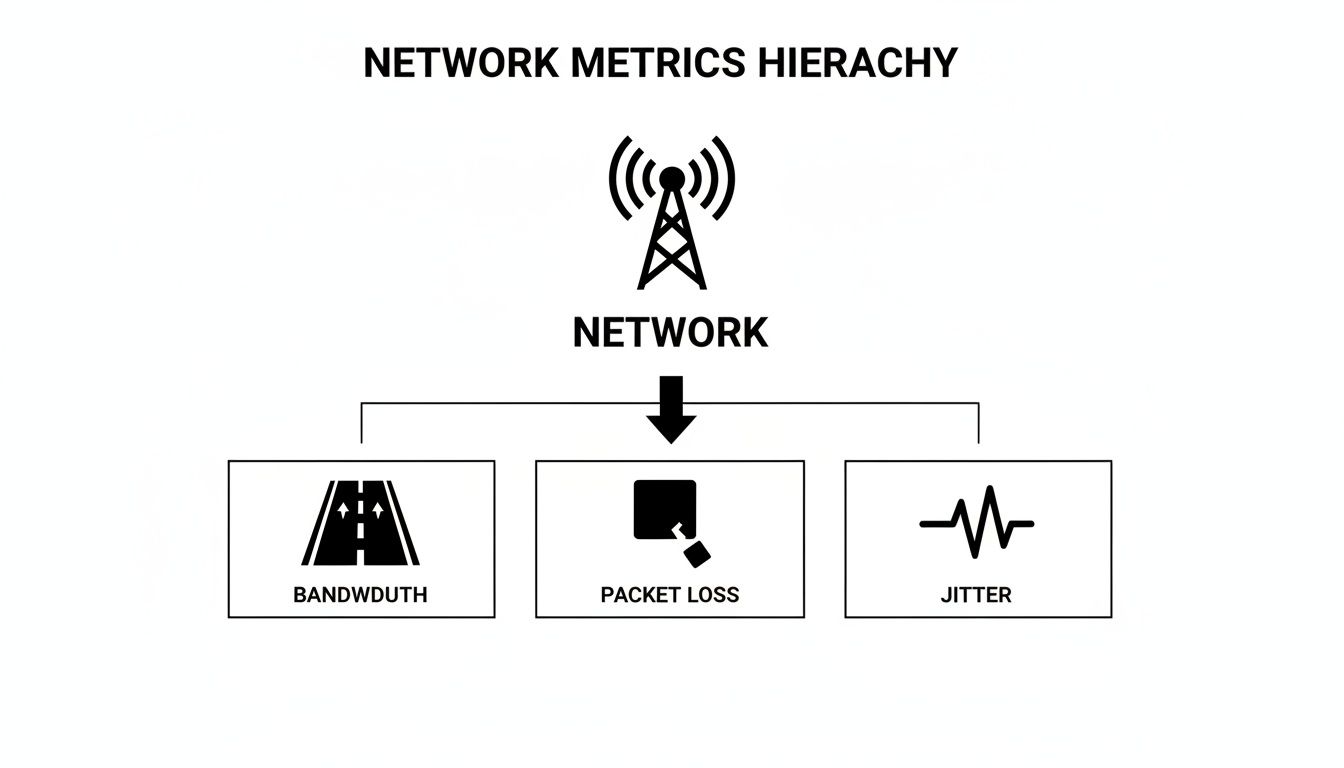
Bandwidth and Throughput: The Lanes on Your Highway
Bandwidth is probably the network term you've heard most often. In our highway analogy, bandwidth is the total number of lanes you have. More lanes mean your highway can theoretically handle more traffic at once. A business with plenty of bandwidth can juggle video conferences, cloud backups, and customer downloads simultaneously without breaking a sweat.
But here’s the catch: bandwidth is just potential. The metric that truly tells the story of your network performance is Throughput. Throughput measures the actual amount of traffic successfully moving down your highway at any given moment. You might be paying for an eight-lane superhighway (high bandwidth), but if unexpected construction closes six of those lanes, your throughput plummets, and traffic grinds to a halt. Measuring throughput reveals how much data is really moving, helping you spot the gap between the service you pay for and what you’re actually getting.
Packet Loss: Cargo Falling Off the Truck
Your data doesn't travel in one big chunk; it's broken down into small bundles called packets. Packet Loss happens when some of these packets never make it to their destination. Picture a delivery truck hitting a massive pothole and losing a few boxes of cargo along its route. While some apps can request the lost data to be resent, that process introduces delays and seriously degrades performance.
Even a tiny amount of packet loss can have a huge, noticeable impact:
- VoIP Calls: Missing packets are the culprit behind choppy audio, dropped words, and frustrating conversations.
- Video Conferencing: This is what causes video to freeze, lag, or turn into a pixelated mess.
- File Transfers: Lost packets force the system to resend the missing pieces, slowing down downloads and uploads to a crawl.
A packet loss rate of just 1% can slash your network's throughput by as much as 10%. For a small or midsize business, this seemingly minor issue can make cloud applications feel unusable and frustrate employees and customers alike.
Jitter: The Unpredictable Arrival Times
Our final key network metric is Jitter, which measures the variation in the arrival time of those data packets. Back to our highway analogy: jitter is like a convoy of delivery trucks all leaving at the same time but arriving completely out of order—some early, some late, and none in the right sequence. This chaos makes it impossible to reassemble the cargo correctly at the destination.
Jitter is the ultimate enemy of real-time applications like phone calls and video streams. The receiving computer expects a smooth, consistent flow of data. When jitter is high, you get garbled audio and distorted video because the packets are arriving in a jumbled mess. For any business in Western Pennsylvania or Eastern Ohio relying on tools like Microsoft Teams or Zoom for client meetings, keeping jitter low is absolutely critical to maintaining a professional image.
The digital world moves fast, and your network must keep up. As highlighted in Cisco's Annual Internet Report, global broadband speeds have surged, with fixed connections hitting an average of 110.4 Mbps by 2023. A slow network is no longer acceptable—research shows a mere one-second delay in page load time can slash conversions by 7%. For SMBs, optimizing these network metrics isn't just an IT task; it's a direct line to staying competitive and ensuring smooth, profitable operations.
Turning Performance Data into Business Strategy